![]() v1.3
v1.3
Monitoring Back Pressure
Flink’s web interface provides a tab to monitor the back pressure behaviour of running jobs.
Back Pressure
If you see a back pressure warning (e.g. High) for a task, this means that it is producing data faster than the downstream operators can consume. Records in your job flow downstream (e.g. from sources to sinks) and back pressure is propagated in the opposite direction, up the stream.
Take a simple Source -> Sink job as an example. If you see a warning for Source, this means that Sink is consuming data slower than Source is producing. Sink is back pressuring the upstream operator Source.
Sampling Threads
Back pressure monitoring works by repeatedly taking stack trace samples of your running tasks. The JobManager triggers repeated calls to Thread.getStackTrace() for the tasks of your job.
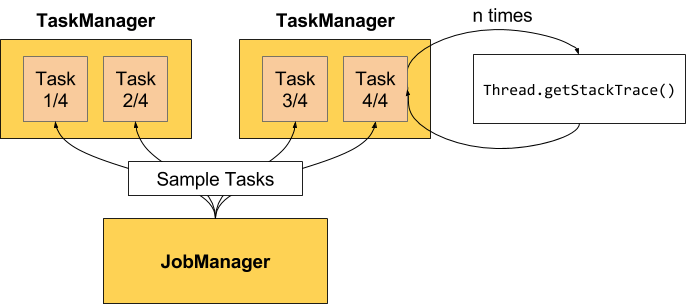
If the samples show that a task Thread is stuck in a certain internal method call (requesting buffers from the network stack), this indicates that there is back pressure for the task.
By default, the job manager triggers 100 stack traces every 50ms for each task in order to determine back pressure. The ratio you see in the web interface tells you how many of these stack traces were stuck in the internal method call, e.g. 0.01 indicates that only 1 in 100 was stuck in that method.
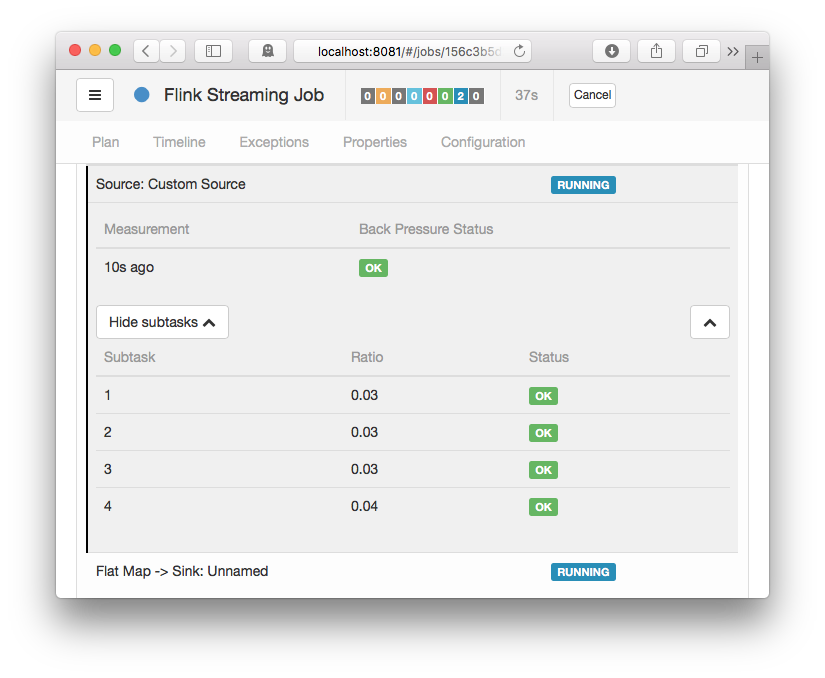
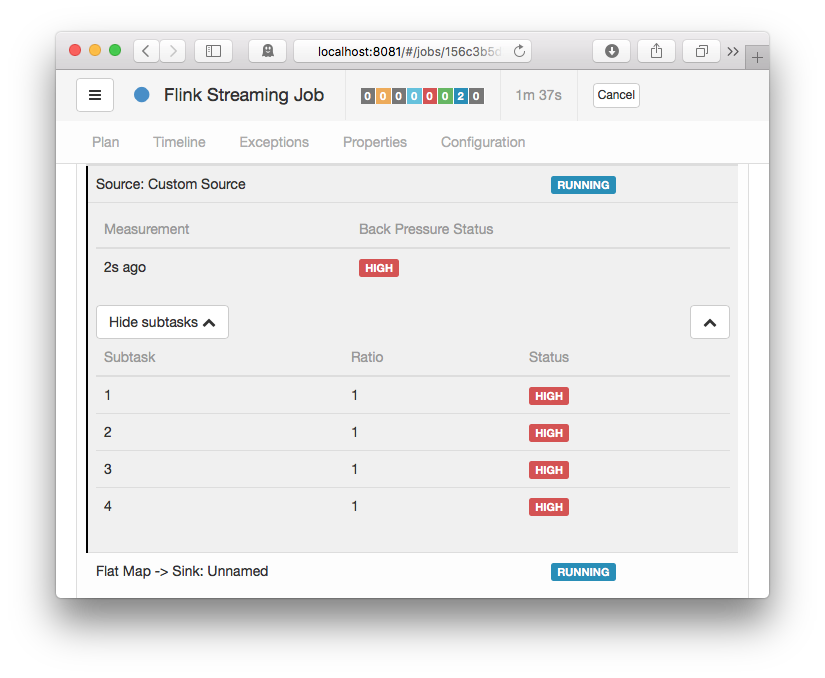
- OK: 0 <= Ratio <= 0.10
- LOW: 0.10 < Ratio <= 0.5
- HIGH: 0.5 < Ratio <= 1
In order to not overload the task managers with stack trace samples, the web interface refreshes samples only after 60 seconds.
Configuration
You can configure the number of samples for the job manager with the following configuration keys:
jobmanager.web.backpressure.refresh-interval: Time after which available stats are deprecated and need to be refreshed (DEFAULT: 60000, 1 min).jobmanager.web.backpressure.num-samples: Number of stack trace samples to take to determine back pressure (DEFAULT: 100).jobmanager.web.backpressure.delay-between-samples: Delay between stack trace samples to determine back pressure (DEFAULT: 50, 50 ms).
Example
You can find the Back Pressure tab next to the job overview.
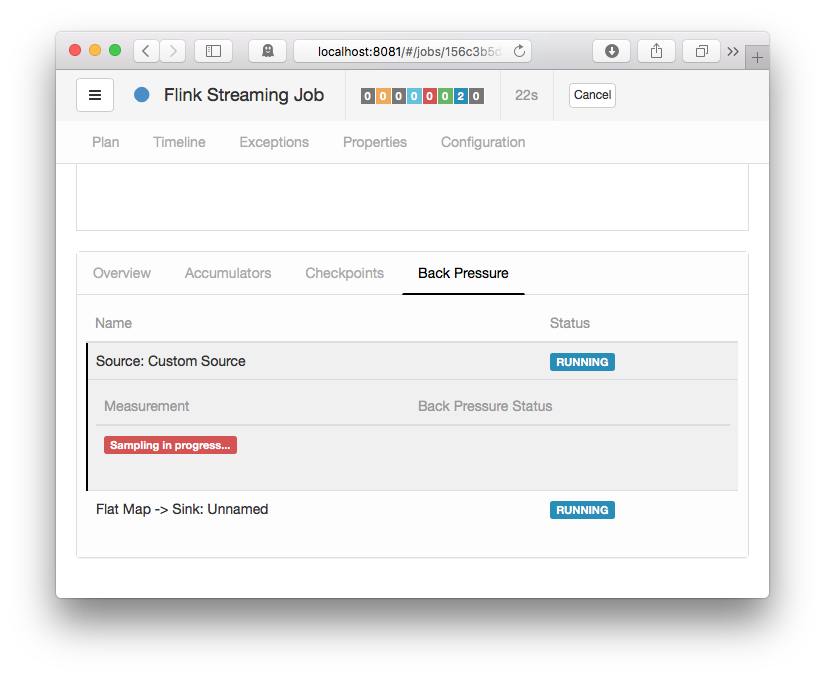
Sampling In Progress
This means that the JobManager triggered a stack trace sample of the running tasks. With the default configuration, this takes about 5 seconds to complete.
Note that clicking the row, you trigger the sample for all subtasks of this operator.
Back Pressure Status
If you see status OK for the tasks, there is no indication of back pressure. HIGH on the other hand means that the tasks are back pressured.