![]() v1.7
v1.7
- Home
- Concepts
- Tutorials
- Examples
- Application Development
- Deployment & Operations
- Debugging & Monitoring
- Flink Development
- Internals
- Javadocs
- Scaladocs
- Project Page
- Application Development
- Managing Execution
- Execution Plans
Execution Plans
Depending on various parameters such as data size or number of machines in the cluster, Flink’s optimizer automatically chooses an execution strategy for your program. In many cases, it can be useful to know how exactly Flink will execute your program.
Plan Visualization Tool
Flink comes packaged with a visualization tool for execution plans. The HTML document containing
the visualizer is located under tools/planVisualizer.html. It takes a JSON representation of
the job execution plan and visualizes it as a graph with complete annotations of execution
strategies.
The following code shows how to print the execution plan JSON from your program:
final ExecutionEnvironment env = ExecutionEnvironment.getExecutionEnvironment();

...

System.out.println(env.getExecutionPlan());
val env = ExecutionEnvironment.getExecutionEnvironment
...
println(env.getExecutionPlan())To visualize the execution plan, do the following:
- Open
planVisualizer.htmlwith your web browser, - Paste the JSON string into the text field, and
- Press the draw button.
After these steps, a detailed execution plan will be visualized.
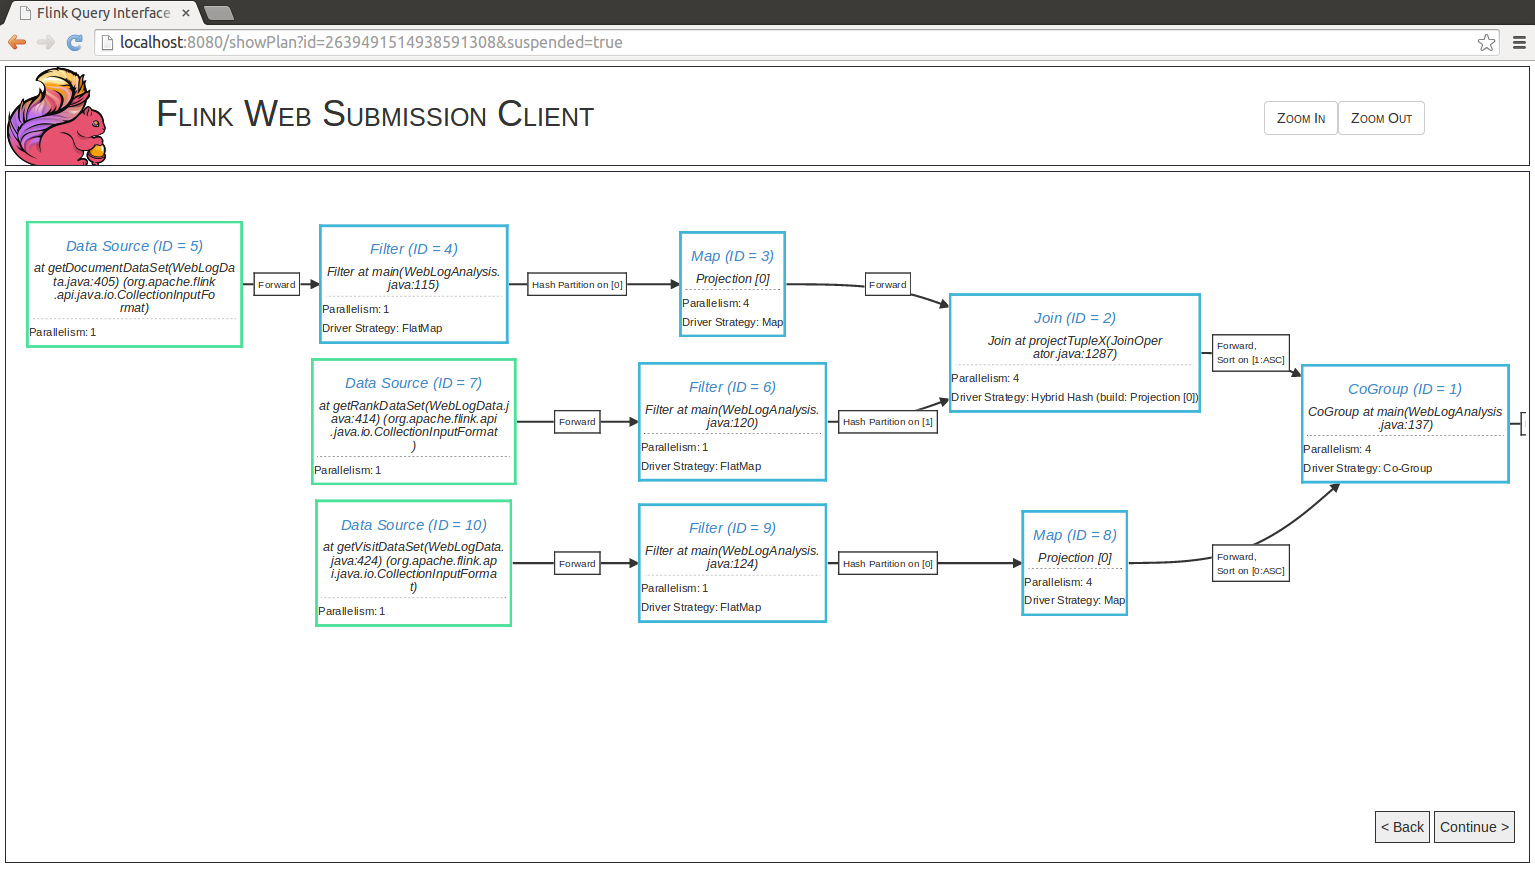
Web Interface
Flink offers a web interface for submitting and executing jobs. The interface is part of the JobManager’s
web interface for monitoring, per default running on port 8081. Job submission via this interfaces requires
that you have set web.submit.enable: true in flink-conf.yaml.
You may specify program arguments before the job is executed. The plan visualization enables you to show the execution plan before executing the Flink job.