Flink Operations Playground
There are many ways to deploy and operate Apache Flink in various environments. Regardless of this variety, the fundamental building blocks of a Flink Cluster remain the same, and similar operational principles apply.
In this playground, you will learn how to manage and run Flink Jobs. You will see how to deploy and monitor an application, experience how Flink recovers from Job failure, and perform everyday operational tasks like upgrades and rescaling.
Anatomy of this Playground
This playground consists of a long living Flink Session Cluster and a Kafka Cluster.
A Flink Cluster always consists of a Flink Master and one or more Flink TaskManagers. The Flink Master is responsible for handling Job submissions, the supervision of Jobs as well as resource management. The Flink TaskManagers are the worker processes and are responsible for the execution of the actual Tasks which make up a Flink Job. In this playground you will start with a single TaskManager, but scale out to more TaskManagers later. Additionally, this playground comes with a dedicated client container, which we use to submit the Flink Job initially and to perform various operational tasks later on. The client container is not needed by the Flink Cluster itself but only included for ease of use.
The Kafka Cluster consists of a Zookeeper server and a Kafka Broker.

When the playground is started a Flink Job called Flink Event Count will be submitted to the Flink Master. Additionally, two Kafka Topics input and output are created.

The Job consumes ClickEvents from the input topic, each with a timestamp and a page. The
events are then keyed by page and counted in 15 second
windows. The results are written to the
output topic.
There are six different pages and we generate 1000 click events per page and 15 seconds. Hence, the output of the Flink job should show 1000 views per page and window.
Starting the Playground
The playground environment is set up in just a few steps. We will walk you through the necessary commands and show how to validate that everything is running correctly.
We assume that you have Docker (1.12+) and docker-compose (2.1+) installed on your machine.
The required configuration files are available in the flink-playgrounds repository. Check it out and spin up the environment:
git clone --branch release-1.10 https://github.com/apache/flink-playgrounds.git
cd flink-playgrounds/operations-playground
docker-compose build
docker-compose up -d
Afterwards, you can inspect the running Docker containers with the following command:
docker-compose ps

                    Name                                  Command               State                   Ports
-----------------------------------------------------------------------------------------------------------------------------
operations-playground_clickevent-generator_1   /docker-entrypoint.sh java ...   Up       6123/tcp, 8081/tcp
operations-playground_client_1                 /docker-entrypoint.sh flin ...   Exit 0
operations-playground_jobmanager_1             /docker-entrypoint.sh jobm ...   Up       6123/tcp, 0.0.0.0:8081->8081/tcp
operations-playground_kafka_1                  start-kafka.sh                   Up       0.0.0.0:9094->9094/tcp
operations-playground_taskmanager_1            /docker-entrypoint.sh task ...   Up       6123/tcp, 8081/tcp
operations-playground_zookeeper_1              /bin/sh -c /usr/sbin/sshd  ...   Up       2181/tcp, 22/tcp, 2888/tcp, 3888/tcp
This indicates that the client container has successfully submitted the Flink Job (Exit 0) and all
cluster components as well as the data generator are running (Up).
You can stop the playground environment by calling:
docker-compose down -vEntering the Playground
There are many things you can try and check out in this playground. In the following two sections we will show you how to interact with the Flink Cluster and demonstrate some of Flink’s key features.
Flink WebUI
The most natural starting point to observe your Flink Cluster is the WebUI exposed under http://localhost:8081. If everything went well, you’ll see that the cluster initially consists of one TaskManager and executes a Job called Click Event Count.
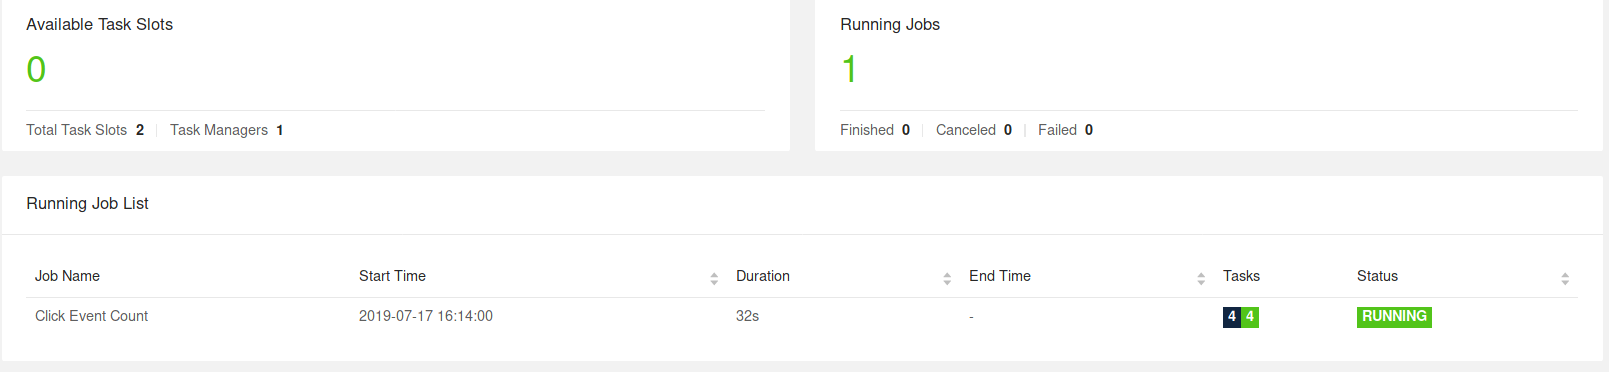
The Flink WebUI contains a lot of useful and interesting information about your Flink Cluster and its Jobs (JobGraph, Metrics, Checkpointing Statistics, TaskManager Status,…).
Logs
JobManager
The JobManager logs can be tailed via docker-compose.
docker-compose logs -f jobmanagerAfter the initial startup you should mainly see log messages for every checkpoint completion.
TaskManager
The TaskManager log can be tailed in the same way.
docker-compose logs -f taskmanagerAfter the initial startup you should mainly see log messages for every checkpoint completion.
Flink CLI
The Flink CLI can be used from within the client container. For
example, to print the help message of the Flink CLI you can run
docker-compose run --no-deps client flink --helpFlink REST API
The Flink REST API is exposed via
localhost:8081 on the host or via jobmanager:8081 from the client container, e.g. to list all
currently running jobs, you can run:
curl localhost:8081/jobsKafka Topics
You can look at the records that are written to the Kafka Topics by running
//input topic (1000 records/s)
docker-compose exec kafka kafka-console-consumer.sh \
  --bootstrap-server localhost:9092 --topic input

//output topic (24 records/min)
docker-compose exec kafka kafka-console-consumer.sh \
--bootstrap-server localhost:9092 --topic outputTime to Play!
Now that you learned how to interact with Flink and the Docker containers, let’s have a look at some common operational tasks that you can try out on our playground. All of these tasks are independent of each other, i.e. you can perform them in any order. Most tasks can be executed via the CLI and the REST API.
Listing Running Jobs
Command
docker-compose run --no-deps client flink listExpected Output
Waiting for response...
------------------ Running/Restarting Jobs -------------------
16.07.2019 16:37:55 : <job-id> : Click Event Count (RUNNING)
--------------------------------------------------------------
No scheduled jobs.
Request
curl localhost:8081/jobsExpected Response (pretty-printed)
{
  "jobs": [
    {
      "id": "<job-id>",
      "status": "RUNNING"
    }
  ]
}
The JobID is assigned to a Job upon submission and is needed to perform actions on the Job via the CLI or REST API.
Observing Failure & Recovery
Flink provides exactly-once processing guarantees under (partial) failure. In this playground you can observe and - to some extent - verify this behavior.
Step 1: Observing the Output
As described above, the events in this playground are generate such that each window contains exactly one thousand records. So, in order to verify that Flink successfully recovers from a TaskManager failure without data loss or duplication you can tail the output topic and check that - after recovery - all windows are present and the count is correct.
For this, start reading from the output topic and leave this command running until after recovery (Step 3).
docker-compose exec kafka kafka-console-consumer.sh \
  --bootstrap-server localhost:9092 --topic output
Step 2: Introducing a Fault
In order to simulate a partial failure you can kill a TaskManager. In a production setup, this could correspond to a loss of the TaskManager process, the TaskManager machine or simply a transient exception being thrown from the framework or user code (e.g. due to the temporary unavailability of an external resource).
docker-compose kill taskmanagerAfter a few seconds, the Flink Master will notice the loss of the TaskManager, cancel the affected Job, and
immediately resubmit it for recovery.
When the Job gets restarted, its tasks remain in the SCHEDULED state, which is indicated by the
purple colored squares (see screenshot below).
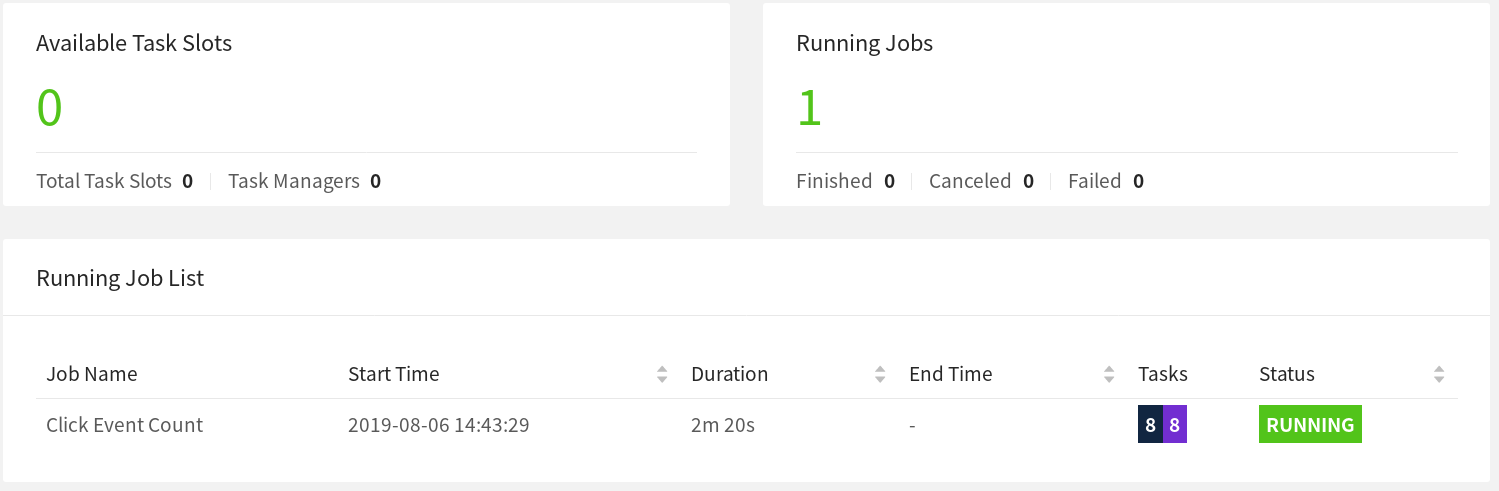
Note: Even though the tasks of the job are in SCHEDULED state and not RUNNING yet, the overall status of a Job is shown as RUNNING.
At this point, the tasks of the Job cannot move from the SCHEDULED state to RUNNING because there
are no resources (TaskSlots provided by TaskManagers) to the run the tasks.
Until a new TaskManager becomes available, the Job will go through a cycle of cancellations and resubmissions.
In the meantime, the data generator keeps pushing ClickEvents into the input topic. This is
similar to a real production setup where data is produced while the Job to process it is down.
Step 3: Recovery
Once you restart the TaskManager, it reconnects to the Master.
docker-compose up -d taskmanagerWhen the Master is notified about the new TaskManager, it schedules the tasks of the
recovering Job to the newly available TaskSlots. Upon restart, the tasks recover their state from
the last successful checkpoint that was taken
before the failure and switch to the RUNNING state.
The Job will quickly process the full backlog of input events (accumulated during the outage)
from Kafka and produce output at a much higher rate (> 24 records/minute) until it reaches
the head of the stream. In the output you will see that all keys (pages) are present for all time
windows and that every count is exactly one thousand. Since we are using the
FlinkKafkaProducer
in its “at-least-once” mode, there is a chance that you will see some duplicate output records.
Note: Most production setups rely on a resource manager (Kubernetes, Yarn, Mesos) to automatically restart failed processes.
Upgrading & Rescaling a Job
Upgrading a Flink Job always involves two steps: First, the Flink Job is gracefully stopped with a Savepoint. A Savepoint is a consistent snapshot of the complete application state at a well-defined, globally consistent point in time (similar to a checkpoint). Second, the upgraded Flink Job is started from the Savepoint. In this context “upgrade” can mean different things including the following:
- An upgrade to the configuration (incl. the parallelism of the Job)
- An upgrade to the topology of the Job (added/removed Operators)
- An upgrade to the user-defined functions of the Job
Before starting with the upgrade you might want to start tailing the output topic, in order to observe that no data is lost or corrupted in the course the upgrade.
docker-compose exec kafka kafka-console-consumer.sh \
  --bootstrap-server localhost:9092 --topic output
Step 1: Stopping the Job
To gracefully stop the Job, you need to use the “stop” command of either the CLI or the REST API. For this you will need the JobID of the Job, which you can obtain by listing all running Jobs or from the WebUI. With the JobID you can proceed to stopping the Job:
Command
docker-compose run --no-deps client flink stop <job-id>Expected Output
Suspending job "<job-id>" with a savepoint.
Suspended job "<job-id>" with a savepoint.
The Savepoint has been stored to the state.savepoint.dir configured in the flink-conf.yaml,
which is mounted under /tmp/flink-savepoints-directory/ on your local machine. You will need the
path to this Savepoint in the next step. In case of the REST API this path was already part of the
response, you will need to have a look at the filesystem directly.
Command
ls -lia /tmp/flink-savepoints-directoryExpected Output
total 0
  17 drwxr-xr-x   3 root root   60 17 jul 17:05 .
   2 drwxrwxrwt 135 root root 3420 17 jul 17:09 ..
1002 drwxr-xr-x   2 root root  140 17 jul 17:05 savepoint-<short-job-id>-<uuid>
Request
# triggering stop
curl -X POST localhost:8081/jobs/<job-id>/stop -d '{"drain": false}'
Expected Response (pretty-printed)
{
  "request-id": "<trigger-id>"
}
Request
# check status of stop action and retrieve savepoint path
 curl localhost:8081/jobs/<job-id>/savepoints/<trigger-id>
Expected Response (pretty-printed)
{
  "status": {
    "id": "COMPLETED"
  },
  "operation": {
    "location": "<savepoint-path>"
  }
Step 2a: Restart Job without Changes
You can now restart the upgraded Job from this Savepoint. For simplicity, you can start by restarting it without any changes.
Command
docker-compose run --no-deps client flink run -s <savepoint-path> \
  -d /opt/ClickCountJob.jar \
  --bootstrap.servers kafka:9092 --checkpointing --event-time
Expected Output
Starting execution of program
Job has been submitted with JobID <job-id>
Request
# Uploading the JAR from the Client container
docker-compose run --no-deps client curl -X POST -H "Expect:" \
  -F "jarfile=@/opt/ClickCountJob.jar" http://jobmanager:8081/jars/upload
Expected Response (pretty-printed)
{
  "filename": "/tmp/flink-web-<uuid>/flink-web-upload/<jar-id>",
  "status": "success"
}
Request
# Submitting the Job
curl -X POST http://localhost:8081/jars/<jar-id>/run \
  -d '{"programArgs": "--bootstrap.servers kafka:9092 --checkpointing --event-time", "savepointPath": "<savepoint-path>"}'
Expected Response (pretty-printed)
{
  "jobid": "<job-id>"
}
Once the Job is RUNNING again, you will see in the output Topic that records are produced at a
higher rate while the Job is processing the backlog accumulated during the outage. Additionally,
you will see that no data was lost during the upgrade: all windows are present with a count of
exactly one thousand.
Step 2b: Restart Job with a Different Parallelism (Rescaling)
Alternatively, you could also rescale the Job from this Savepoint by passing a different parallelism during resubmission.
Command
docker-compose run --no-deps client flink run -p 3 -s <savepoint-path> \
  -d /opt/ClickCountJob.jar \
  --bootstrap.servers kafka:9092 --checkpointing --event-time
Expected Output
Starting execution of program
Job has been submitted with JobID <job-id>
Request
# Uploading the JAR from the Client container
docker-compose run --no-deps client curl -X POST -H "Expect:" \
  -F "jarfile=@/opt/ClickCountJob.jar" http://jobmanager:8081/jars/upload
Expected Response (pretty-printed)
{
  "filename": "/tmp/flink-web-<uuid>/flink-web-upload/<jar-id>",
  "status": "success"
}
Request
# Submitting the Job
curl -X POST http://localhost:8081/jars/<jar-id>/run \
  -d '{"parallelism": 3, "programArgs": "--bootstrap.servers kafka:9092 --checkpointing --event-time", "savepointPath": "<savepoint-path>"}'
Expected Response (pretty-printed
{
  "jobid": "<job-id>"
}
Now, the Job has been resubmitted, but it will not start as there are not enough TaskSlots to execute it with the increased parallelism (2 available, 3 needed). With
docker-compose scale taskmanager=2you can add a second TaskManager with two TaskSlots to the Flink Cluster, which will automatically register with the Flink Master. Shortly after adding the TaskManager the Job should start running again.
Once the Job is “RUNNING” again, you will see in the output Topic that now data was lost during rescaling: all windows are present with a count of exactly one thousand.
Querying the Metrics of a Job
The Flink Master exposes system and user metrics via its REST API.
The endpoint depends on the scope of these metrics. Metrics scoped to a Job can be listed via
jobs/<job-id>/metrics. The actual value of a metric can be queried via the get query parameter.
Request
curl "localhost:8081/jobs/<jod-id>/metrics?get=lastCheckpointSize"Expected Response (pretty-printed; no placeholders)
[
  {
    "id": "lastCheckpointSize",
    "value": "9378"
  }
]
The REST API can not only be used to query metrics, but you can also retrieve detailed information about the status of a running Job.
Request
# find the vertex-id of the vertex of interest
curl localhost:8081/jobs/<jod-id>
Expected Response (pretty-printed)
{
  "jid": "<job-id>",
  "name": "Click Event Count",
  "isStoppable": false,
  "state": "RUNNING",
  "start-time": 1564467066026,
  "end-time": -1,
  "duration": 374793,
  "now": 1564467440819,
  "timestamps": {
    "CREATED": 1564467066026,
    "FINISHED": 0,
    "SUSPENDED": 0,
    "FAILING": 0,
    "CANCELLING": 0,
    "CANCELED": 0,
    "RECONCILING": 0,
    "RUNNING": 1564467066126,
    "FAILED": 0,
    "RESTARTING": 0
  },
  "vertices": [
    {
      "id": "<vertex-id>",
      "name": "ClickEvent Source",
      "parallelism": 2,
      "status": "RUNNING",
      "start-time": 1564467066423,
      "end-time": -1,
      "duration": 374396,
      "tasks": {
        "CREATED": 0,
        "FINISHED": 0,
        "DEPLOYING": 0,
        "RUNNING": 2,
        "CANCELING": 0,
        "FAILED": 0,
        "CANCELED": 0,
        "RECONCILING": 0,
        "SCHEDULED": 0
      },
      "metrics": {
        "read-bytes": 0,
        "read-bytes-complete": true,
        "write-bytes": 5033461,
        "write-bytes-complete": true,
        "read-records": 0,
        "read-records-complete": true,
        "write-records": 166351,
        "write-records-complete": true
      }
    },
    {
      "id": "<vertex-id>",
      "name": "Timestamps/Watermarks",
      "parallelism": 2,
      "status": "RUNNING",
      "start-time": 1564467066441,
      "end-time": -1,
      "duration": 374378,
      "tasks": {
        "CREATED": 0,
        "FINISHED": 0,
        "DEPLOYING": 0,
        "RUNNING": 2,
        "CANCELING": 0,
        "FAILED": 0,
        "CANCELED": 0,
        "RECONCILING": 0,
        "SCHEDULED": 0
      },
      "metrics": {
        "read-bytes": 5066280,
        "read-bytes-complete": true,
        "write-bytes": 5033496,
        "write-bytes-complete": true,
        "read-records": 166349,
        "read-records-complete": true,
        "write-records": 166349,
        "write-records-complete": true
      }
    },
    {
      "id": "<vertex-id>",
      "name": "ClickEvent Counter",
      "parallelism": 2,
      "status": "RUNNING",
      "start-time": 1564467066469,
      "end-time": -1,
      "duration": 374350,
      "tasks": {
        "CREATED": 0,
        "FINISHED": 0,
        "DEPLOYING": 0,
        "RUNNING": 2,
        "CANCELING": 0,
        "FAILED": 0,
        "CANCELED": 0,
        "RECONCILING": 0,
        "SCHEDULED": 0
      },
      "metrics": {
        "read-bytes": 5085332,
        "read-bytes-complete": true,
        "write-bytes": 316,
        "write-bytes-complete": true,
        "read-records": 166305,
        "read-records-complete": true,
        "write-records": 6,
        "write-records-complete": true
      }
    },
    {
      "id": "<vertex-id>",
      "name": "ClickEventStatistics Sink",
      "parallelism": 2,
      "status": "RUNNING",
      "start-time": 1564467066476,
      "end-time": -1,
      "duration": 374343,
      "tasks": {
        "CREATED": 0,
        "FINISHED": 0,
        "DEPLOYING": 0,
        "RUNNING": 2,
        "CANCELING": 0,
        "FAILED": 0,
        "CANCELED": 0,
        "RECONCILING": 0,
        "SCHEDULED": 0
      },
      "metrics": {
        "read-bytes": 20668,
        "read-bytes-complete": true,
        "write-bytes": 0,
        "write-bytes-complete": true,
        "read-records": 6,
        "read-records-complete": true,
        "write-records": 0,
        "write-records-complete": true
      }
    }
  ],
  "status-counts": {
    "CREATED": 0,
    "FINISHED": 0,
    "DEPLOYING": 0,
    "RUNNING": 4,
    "CANCELING": 0,
    "FAILED": 0,
    "CANCELED": 0,
    "RECONCILING": 0,
    "SCHEDULED": 0
  },
  "plan": {
    "jid": "<job-id>",
    "name": "Click Event Count",
    "nodes": [
      {
        "id": "<vertex-id>",
        "parallelism": 2,
        "operator": "",
        "operator_strategy": "",
        "description": "ClickEventStatistics Sink",
        "inputs": [
          {
            "num": 0,
            "id": "<vertex-id>",
            "ship_strategy": "FORWARD",
            "exchange": "pipelined_bounded"
          }
        ],
        "optimizer_properties": {}
      },
      {
        "id": "<vertex-id>",
        "parallelism": 2,
        "operator": "",
        "operator_strategy": "",
        "description": "ClickEvent Counter",
        "inputs": [
          {
            "num": 0,
            "id": "<vertex-id>",
            "ship_strategy": "HASH",
            "exchange": "pipelined_bounded"
          }
        ],
        "optimizer_properties": {}
      },
      {
        "id": "<vertex-id>",
        "parallelism": 2,
        "operator": "",
        "operator_strategy": "",
        "description": "Timestamps/Watermarks",
        "inputs": [
          {
            "num": 0,
            "id": "<vertex-id>",
            "ship_strategy": "FORWARD",
            "exchange": "pipelined_bounded"
          }
        ],
        "optimizer_properties": {}
      },
      {
        "id": "<vertex-id>",
        "parallelism": 2,
        "operator": "",
        "operator_strategy": "",
        "description": "ClickEvent Source",
        "optimizer_properties": {}
      }
    ]
  }
}
Please consult the REST API reference for a complete list of possible queries including how to query metrics of different scopes (e.g. TaskManager metrics);
Variants
You might have noticed that the Click Event Count application was always started with --checkpointing
and --event-time program arguments. By omitting these in the command of the client container in the
docker-compose.yaml, you can change the behavior of the Job.
-
--checkpointingenables checkpoint, which is Flink’s fault-tolerance mechanism. If you run without it and go through failure and recovery, you should will see that data is actually lost. -
--event-timeenables event time semantics for your Job. When disabled, the Job will assign events to windows based on the wall-clock time instead of the timestamp of theClickEvent. Consequently, the number of events per window will not be exactly one thousand anymore.
The Click Event Count application also has another option, turned off by default, that you can
enable to explore the behavior of this job under backpressure. You can add this option in the
command of the client container in docker-compose.yaml.
--backpressureadds an additional operator into the middle of the job that causes severe backpressure during even-numbered minutes (e.g., during 10:12, but not during 10:13). This can be observed by inspecting various network metrics such asoutputQueueLengthandoutPoolUsage, and/or by using the backpressure monitoring available in the WebUI.